
Homebuyers · NRIs · Long-term buyers
Fair value, verify price Local evidence, shown honestly
Your neighbourhood guide
Area around this place · Thane · IN
7/7 evidence signals establishedA field note for curious people
Vasant Vihar Thane
Established Thane West family locality with 3.5% yield and strong daily conveniences
Vasant Vihar is a built-out, family-led Thane West pocket with dense schools, clinics, shops and gardens within walking distance and mid-tier pricing near Rs 19,850 per sq ft. Rents average Rs 58 per sq ft with a sourced 3.
Your neighbourhood guide is ready.
Price vs. quality of life
Is Vasant Vihar Thane worth the price?
Dense schools, clinics, shops and gardens plus a 3.51% sourced gross yield support the price, though maintenance costs and parking strain cap the premium.
Buying price (per sq ft)Rs 12,000-17,000 / sq ft (bulk of deals); asking avg Rs 19,850 / sq ft
Typical monthly rentRs 41,400 / mo (2BHK avg); Rs 25,900 / mo (1BHK)
Yearly rental return~3.5% per year (sourced 3.51%)
New construction & supplyMostly built-out; 77 ready-to-move units plus premium new projects
Find your fit
What is Vasant Vihar Thane actually good for?
Get to know daily life
Everyday essentials
01
mixedCivic & utilities
Functional utilities but scheduled water cuts and elevated society maintenance
Water supply10% TMC cut each Wednesday
TMC water cut runs 24 hrs every Wednesday from late Oct 2026 to 31 Aug 2027; tankers used in peak summer.[1][4]
Society maintenanceRs 1,500-5,000 / mo typical
Square Yards lists maintenance costs as comparatively higher; listings show Rs 5,000/mo on an Rs 83 L flat.[1][4][8]
Society chargesBundled facility billing
A 2014 Thane Consumer Forum order confirms societies bundle security, power, garbage, STP and clubhouse charges.[9]
02
strong15-minute daily life
Dense 15-minute convenience: schools, clinics, shops, gardens and food all close by
Healthcare15 within 2km · nearest 31m
Google Places scan verified 15 healthcare venues within 2km.
Education & learning13 within 2km · nearest 10m
Google Places scan verified 13 education & learning venues within 2km.
Everyday retail20 shopping POIs in 2km
Nearest shopping POI is 36m away; 20 shopping and 20 finance points sit within the 2km catchment.[4][14]
Schools and clinics13 education, 15 healthcare
Nearest school POI is 10m and nearest health store 31m, with Prachi Hospital about 0.1 km away.[4]
03
mixedCommute & connectivity
Good road links and station access, but commuter-driven with peak-hour friction
04
mixedNew projects & what is changing
Built-out locality with premium projects and community events, few new catalysts
Supply mix77 ready units plus premium towers
Kalpataru Siddhachal and Godrej Pine list near Rs 27,150-27,200 per sq ft; ready stock trades near Rs 16,700 per sq ft.[1]
Community eventsHappy Streets 6,000+
The 1.7 km car-free Happy Streets run on Gladys Alvares Road has drawn 6,000 to 7,000 plus participants.[21][22]
New catalystsNone material identified
Dossier shows no major new infrastructure project inside the locality beyond existing road and retail stock.[4]
05
strongBuying price & rent value
Mid-tier pricing with a sourced 3.51% yield outpacing the Ghodbunder corridor
Through the year
A typical year around Vasant Vihar Thane
Monthly averages from 2023–2025 show how air quality and weather change with the seasons.
Monthly mean US AQI
US AQIRegional model · approximately 45 km grid
Nov: 167 US AQI3 of 3 baseline years
Air temperature
°CRegional model · approximately 11 km grid
Nov: 26.5 °C3 of 3 baseline years
Monthly rainfall
mm/monthRegional model · approximately 25 km grid
Nov: 6 mm/month3 of 3 baseline years
Relative humidity
%Regional model · approximately 11 km grid
Nov: 65 %3 of 3 baseline years
Monthly averages smooth out individual high-pollution days. Regional model data from Open-Meteo. Sources & methodology
| Month | Monthly mean US AQI | Air temperature (°C) | Monthly rainfall (mm/month) | Relative humidity (%) |
|---|---|---|---|---|
| Jan | 1623/3 years | 24.43/3 years | 03/3 years | 623/3 years |
| Feb | 1543/3 years | 26.23/3 years | 03/3 years | 533/3 years |
| Mar | 1393/3 years | 27.73/3 years | 23/3 years | 583/3 years |
| Apr | 1113/3 years | 29.93/3 years | 13/3 years | 633/3 years |
| May | 853/3 years | 30.23/3 years | 463/3 years | 723/3 years |
| Jun | 723/3 years | 28.53/3 years | 2923/3 years | 823/3 years |
| Jul | 723/3 years | 26.53/3 years | 5413/3 years | 903/3 years |
| Aug | 683/3 years | 26.63/3 years | 2833/3 years | 883/3 years |
| Sep | 693/3 years | 26.53/3 years | 3533/3 years | 883/3 years |
| Oct | 1373/3 years | 27.83/3 years | 763/3 years | 783/3 years |
| Nov | 1673/3 years | 26.53/3 years | 63/3 years | 653/3 years |
| Dec | 1573/3 years | 25.23/3 years | 03/3 years | 603/3 years |
Satellite X-Ray · Measured from orbit
What Vasant Vihar Thane looks like from space
3.5 km radius · Jan – Mar 2025 – Apr – Jun 2026 · Deterministic physical measurements (no AI guesswork)
Heat & shade from space-0.4°C anomaly
Average neighbourhood heat (-0.4°C vs. surroundings)
Surface heat tracks closely with the surrounding city ring (43.1°C roof/road surface temp).
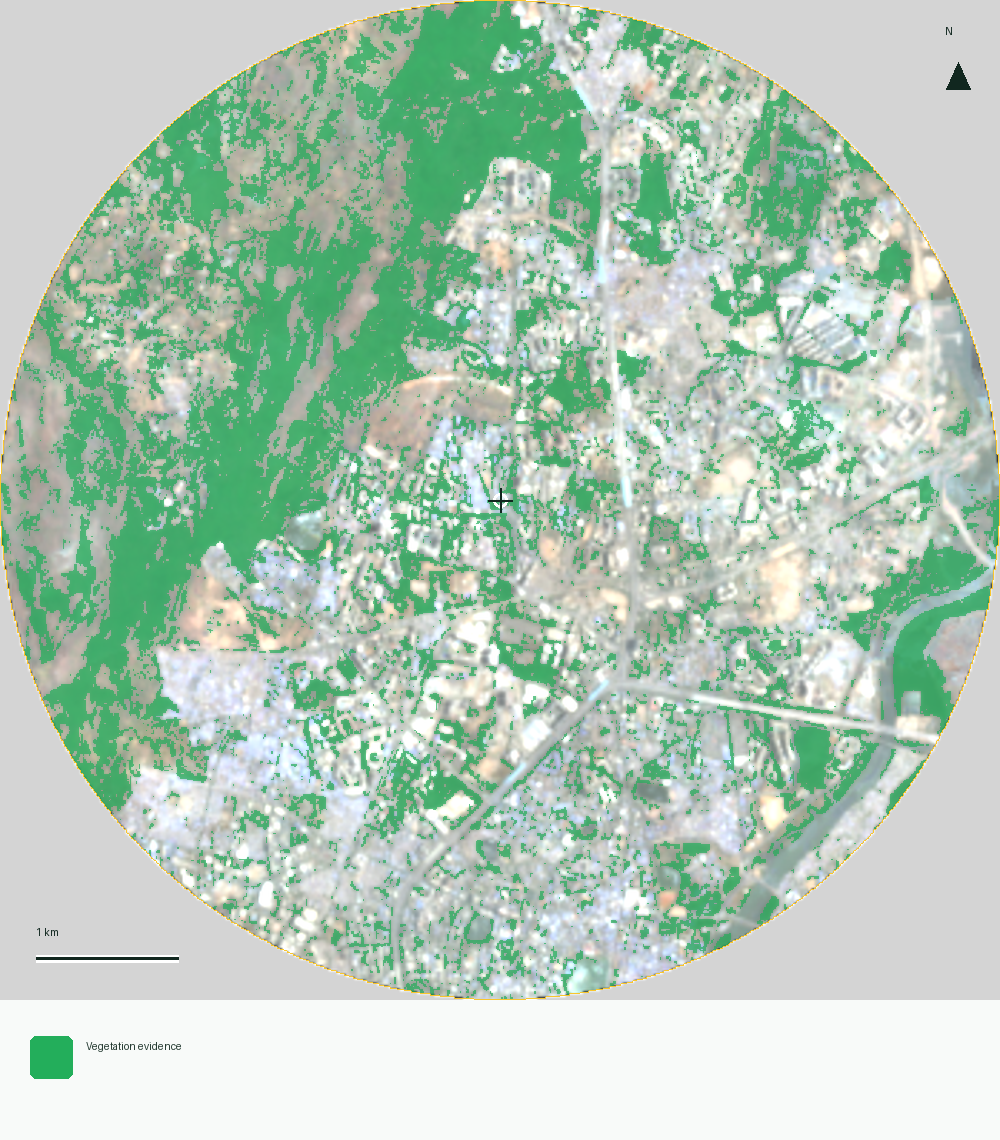
Concrete vs. tree canopy35.8% built · 29.1% green
Leafy canopy pocket (29.1% green · 35.8% built-up)
Over a quarter of the area is covered by trees, gardens, or open vegetation — rare breathing room inside the city.
Topography & rainwater flow57m elev · 43/100 bowl
Moderate terrain slope (43/100 runoff convergence)
Sits at ~57m elevation with typical urban slope; monsoon drainage depends on street-level storm lines.
Spatial catchment radar · 2km radius
Vasant Vihar Thane on the ground
Vasant Vihar Thane is located in Thane, IN.
Right now
Live contextUnavailable
Vasant Vihar ThaneArea around this place · Thane · INMap available when in view
Quality signals · Expected-value index
What the evidence establishes (0–100%)
7 of 7 signals have a cited estimate combining 2km map data and researched fundamentals. Blank scores need more evidence.Nearby & same-budget comparison
Compare Vasant Vihar Thane with nearby & similar-price areas
Inspect the fundamental grids of neighbouring areas and similar-budget pockets side by side to compare buying prices, rental returns, and daily amenities.
Behind this guide
Sources & things to check
26 research sources · air & weather dataOpen
Behind this guide
Sources & things to check
- 01squareyards.com · squareyards.com · accessed 3 Nov 2026
- 02ghar.tv · ghar.tv · accessed 3 Nov 2026
- 03squaremind.in · squaremind.in · accessed 3 Nov 2026
- 04squareyards.com · squareyards.com · accessed 3 Nov 2026
- 0599acres.com · 99acres.com · accessed 3 Nov 2026
- 06housing.com · housing.com · accessed 3 Nov 2026
- 07geoiq.io · geoiq.io · accessed 3 Nov 2026
- 08nestoria.in · nestoria.in · accessed 3 Nov 2026
- 09timesofindia.indiatimes.com · timesofindia.indiatimes.com · accessed 3 Nov 2026
- 10indiaairport.com · indiaairport.com · accessed 3 Nov 2026
- 11top-rated.online · top-rated.online · accessed 3 Nov 2026
- 12sg.trip.com · sg.trip.com · accessed 3 Nov 2026
- 13airbnb.hu · airbnb.hu · accessed 3 Nov 2026
- 14zomato.com · zomato.com · accessed 3 Nov 2026
- 15magicpin.in · magicpin.in · accessed 3 Nov 2026
- 16top-rated.online · top-rated.online · accessed 3 Nov 2026
- 17restaurant-guru.in · restaurant-guru.in · accessed 3 Nov 2026
- 18timesofurbania.substack.com · timesofurbania.substack.com · accessed 3 Nov 2026
- 19mapcarta.com · mapcarta.com · accessed 3 Nov 2026
- 20redesign.squareyards.com · redesign.squareyards.com · accessed 3 Nov 2026
- 21timesofindia.indiatimes.com · timesofindia.indiatimes.com · accessed 3 Nov 2026
- 22timesofindia.indiatimes.com · timesofindia.indiatimes.com · accessed 3 Nov 2026
- 2399acres.com · 99acres.com · accessed 3 Nov 2026
- 24housing.com · housing.com · accessed 3 Nov 2026
- 25squareyards.com · squareyards.com · accessed 3 Nov 2026
- 2699acres.com · 99acres.com · accessed 3 Nov 2026
Air & weather: sources and methodology
Monthly averages cover 2023–2025. Each year’s monthly value is calculated first, then qualifying years receive equal weight. AQI, temperature and humidity require 90% observation coverage; rainfall requires complete daily totals. At least two years support every displayed month. Gaps show insufficient coverage.
Air quality uses mean US AQI. Temperature is air temperature at 2 metres; humidity is relative humidity at 2 metres. Rainfall is the average of each year’s monthly rainfall total. Observations use Asia/Kolkata. Collected 2026-10-20.
- Monthly mean US AQI
CAMS global archived atmospheric composition forecasts · approximately 45 km grid. Open-Meteo (CC BY 4.0); Copernicus Atmosphere Monitoring Service.
Modelled · experimental. Grid centre 19.20, 73.00.
- Air temperature
ERA5-Land historical weather · approximately 11 km grid. Open-Meteo (CC BY 4.0); Copernicus Climate Change Service / ERA5-Land.
Modelled · experimental. Grid centre 19.20, 73.00.
- Monthly rainfall
ERA5 historical rainfall · approximately 25 km grid. Open-Meteo (CC BY 4.0); Copernicus Climate Change Service / ERA5.
Modelled · experimental. Grid centre 19.25, 73.00.
- Relative humidity
ERA5-Land historical weather · approximately 11 km grid. Open-Meteo (CC BY 4.0); Copernicus Climate Change Service / ERA5-Land.
Modelled · experimental. Grid centre 19.20, 73.00.
These regional patterns provide seasonal context. Monthly means smooth out individual high-pollution days.
Local voices
What the web cannot know on its own.
Personal experience stays separate from sourced research and only becomes a public pattern after the privacy threshold.Know it firsthand?
Tell us what daily life actually feels like.
Ten structured questions create a personal portrait before community patterns enter the room.Community local read
Patterns appear after enough eligible local voices.
Your contribution can be saved now. Counts and percentages stay hidden until the privacy threshold is met.Field notes Beta
What's happening on the ground.
0 notes · 0 activeLoading field notes…
Start with your local read
Measurements work best when we know how you know the place.
Complete the neighborhood read, then take a focused four-signal mission.Satellite analysis · published
The physical story of Vasant Vihar Thane.
Satellite evidence showed vegetation across 29.1% of the usable area inside the analysis circle. Developed or hard-surface land was mapped across 35.8% of the usable area. Both water-detection methods agreed across 0.7% of the usable area. The wider one-method water evidence covered 1.9%.
Green cover29.1%
Built-up area35.8%
Surface temperature43.1°C
Air quality44 (India CPCB)