
Homebuyers · NRIs · Long-term buyers
Verify fundamentals first Local evidence, shown honestly
Your neighbourhood guide
Neighbourhood · Bhim Nagar · Pune Division · Panchgani
7/7 evidence signals establishedA field note for curious people
Gowthan
Strained hill-station core with strong daily basics and tourist-driven congestion
Gowthan is Panchgani's busy commercial core, dense with shops, clinics, schools and temples within 2 km, but water is now rationed alternate-day and the arterial road gridlocks in season. Prices track premium hill-resort demand while infrastructure lags; best suited to hospitality investors and buyers tolerant of civic strain.
Your neighbourhood guide is ready.
Price vs. quality of life
Is Gowthan worth the price?
Strong daily amenity density and clean-city credentials sit alongside water rationing and chronic road congestion, so you pay a hill-resort premium for infrastructure still catching up.
Buying price (per sq ft)Not established
Typical monthly rentNot established
Yearly rental returnNot established
New construction & supplyMostly built-out low-rise; small phase-wise RERA launches
Find your fit
What is Gowthan actually good for?
Get to know daily life
Everyday essentials
01
strainedCivic & utilities
Water rationing, monsoon-damaged roads and frequent outages offset a strong waste record
Water supplyAlternate-day rationing (Apr 2026)
Venna Lake storage fell to about 20 MCFT, forcing every-other-day supply and hotel tanker purchases.[2]
Sewerage and drainage2 STPs, 1 MLD capacity
Underground drainage laid under UIDSSMT; NMCG flags one 1.5 MLD STP as non-compliant.[1][19]
02
strong15-minute daily life
Very dense 15-minute convenience: clinics, schools, shops, temples and parks all nearby
Healthcare14 within 2 km, nearest 23 m
Vasudev Hospital, Life Care Speciality and Panchgani Orthopaedic Centre serve the core.[1]
Education19 within 2 km, nearest 90 m
New Era High School and Shalom schools anchor Panchgani's boarding-school reputation.[31]
Everyday retail13 shopping, 13 food nearby
Nearest shop 39 m and nearest food outlet 38 m, with strawberry stalls in season.[22]
Green space8 parks within 2 km
Mapro Park and Municipal Garden exist but town-core noise and honking persist at midday.[29]
03
strainedCommute & connectivity
Bus-only access with no rail and a chronically gridlocked single arterial road
Rail accessNo station; Satara about 50 km
Nearest railheads are Satara (~50 km) and Pune (~69-100 km), reached by taxi or ST bus.[24][25]
Bus connectivityIn-town stand, Pune-Mahabaleshwar
MSRTC services via Swargate, Wai and Panchgani run from roughly 00:15 to 23:15.[26]
Congestion2 km tailbacks in season
Contractor negligence created 2-3 hour tourist strandings between Sanjivan Naka and Shivaji Chowk.[9]
04
mixedNew projects & what is changing
Land-locked, low-rise supply with small RERA phases and hospitality-led demand
New supplySmall phase-wise RERA projects
Sankalp Palasha Phase I (possession Jun 2026) and Omkar Flower Valley are the visible launches.[6][13]
Land constraintPlateau and eco-sensitive zoning
Topography and Western Ghats zoning limit greenfield dense residential growth.[33]
05
limitedBuying price & rent value
Hill-resort pricing with limited verified price and rent data for this micro-market
Through the year
A typical year around Gowthan
Monthly averages from 2023–2025 show how air quality and weather change with the seasons.
Monthly mean US AQI
US AQIRegional model · approximately 45 km grid
Nov: 110 US AQI3 of 3 baseline years
Air temperature
°CRegional model · approximately 11 km grid
Nov: 19.4 °C3 of 3 baseline years
Monthly rainfall
mm/monthRegional model · approximately 25 km grid
Nov: 14 mm/month3 of 3 baseline years
Relative humidity
%Regional model · approximately 11 km grid
Nov: 66 %3 of 3 baseline years
Monthly averages smooth out individual high-pollution days. Regional model data from Open-Meteo. Sources & methodology
| Month | Monthly mean US AQI | Air temperature (°C) | Monthly rainfall (mm/month) | Relative humidity (%) |
|---|---|---|---|---|
| Jan | 1163/3 years | 19.43/3 years | 23/3 years | 543/3 years |
| Feb | 1113/3 years | 21.63/3 years | 03/3 years | 413/3 years |
| Mar | 1113/3 years | 233/3 years | 33/3 years | 443/3 years |
| Apr | 1043/3 years | 24.83/3 years | 203/3 years | 533/3 years |
| May | 763/3 years | 23.53/3 years | 2603/3 years | 723/3 years |
| Jun | 493/3 years | 21.33/3 years | 4263/3 years | 883/3 years |
| Jul | 373/3 years | 19.53/3 years | 9733/3 years | 943/3 years |
| Aug | 423/3 years | 19.83/3 years | 4653/3 years | 913/3 years |
| Sep | 463/3 years | 19.63/3 years | 3363/3 years | 913/3 years |
| Oct | 873/3 years | 20.83/3 years | 1093/3 years | 783/3 years |
| Nov | 1103/3 years | 19.43/3 years | 143/3 years | 663/3 years |
| Dec | 1033/3 years | 18.83/3 years | 23/3 years | 583/3 years |
Satellite X-Ray · Measured from orbit
What Gowthan looks like from space
1 km radius · Jan – Mar 2025 – Apr – Jun 2026 · Deterministic physical measurements (no AI guesswork)
Heat & shade from space-0.4°C anomaly
Average neighbourhood heat (-0.4°C vs. surroundings)
Surface heat tracks closely with the surrounding city ring (32.1°C roof/road surface temp).
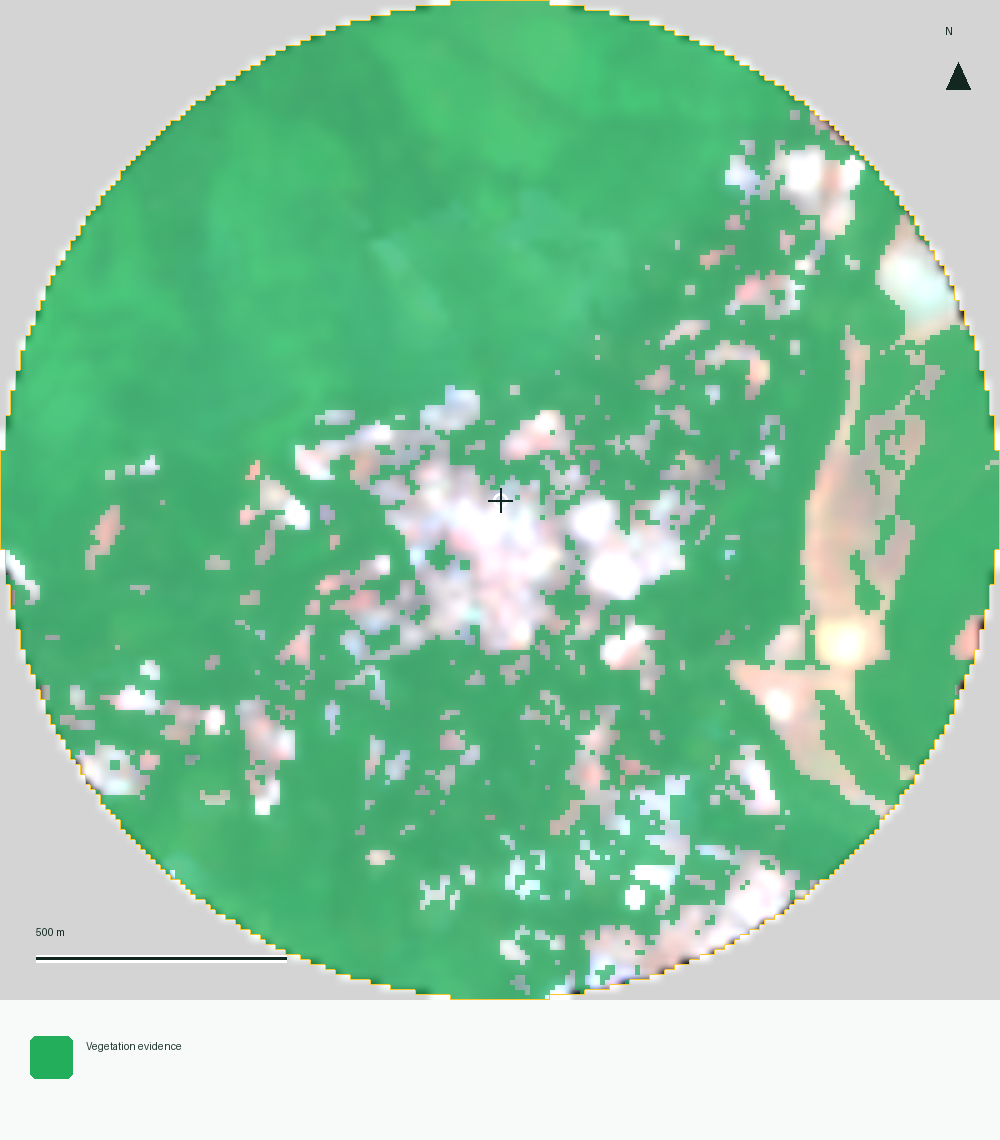
Concrete vs. tree canopy8.4% built · 78.6% green
Leafy canopy pocket (78.6% green · 8.4% built-up)
Over a quarter of the area is covered by trees, gardens, or open vegetation — rare breathing room inside the city.
Topography & rainwater flow1191m elev · 20/100 bowl
Higher / sloped ground (20/100 runoff convergence)
Sits on shedding terrain (~1191m elevation) where rainwater naturally flows outward.
Spatial catchment radar · 2km radius
Gowthan on the ground
Gowthan is located in Bhim Nagar, Pune Division, Panchgani, Maharashtra, India.
Right now
Live contextUnavailable
GowthanNeighbourhood · Bhim Nagar · Pune Division · PanchganiMap available when in view
Quality signals · Expected-value index
What the evidence establishes (0–100%)
7 of 7 signals have a cited estimate combining 2km map data and researched fundamentals. Blank scores need more evidence.Behind this guide
Sources & things to check
35 research sources · air & weather dataOpen
Behind this guide
Sources & things to check
- 01cwas.org.in · cwas.org.in · accessed 20 Oct 2026
- 02pudhari.news · pudhari.news · accessed 20 Oct 2026
- 03hindustantimes.com · hindustantimes.com · accessed 20 Oct 2026
- 04hotelierindia.com · hotelierindia.com · accessed 20 Oct 2026
- 05mypunepulse.com · mypunepulse.com · accessed 20 Oct 2026
- 06housing.com · housing.com · accessed 20 Oct 2026
- 07susana.org · susana.org · accessed 20 Oct 2026
- 08swarajyamag.com · swarajyamag.com · accessed 20 Oct 2026
- 09pudhari.news · pudhari.news · accessed 20 Oct 2026
- 10tarunbharat.com · tarunbharat.com · accessed 20 Oct 2026
- 11athensjournals.gr · athensjournals.gr · accessed 20 Oct 2026
- 12urbanacres.in · urbanacres.in · accessed 20 Oct 2026
- 13housing.com · housing.com · accessed 20 Oct 2026
- 14susana.org · susana.org · accessed 20 Oct 2026
- 15documents1.worldbank.org · documents1.worldbank.org · accessed 20 Oct 2026
- 16beag.in · beag.in · accessed 20 Oct 2026
- 17pudhari.news · pudhari.news · accessed 20 Oct 2026
- 18publictenders.co.in · publictenders.co.in · accessed 20 Oct 2026
- 19nmcg.nic.in · nmcg.nic.in · accessed 20 Oct 2026
- 20sbmurban.org · sbmurban.org · accessed 20 Oct 2026
- 21pureenergy.co.in · pureenergy.co.in · accessed 20 Oct 2026
- 22nakshiq.com · nakshiq.com · accessed 20 Oct 2026
- 23beag.in · beag.in · accessed 20 Oct 2026
- 24ftd.travel · ftd.travel · accessed 20 Oct 2026
- 25trawell.in · trawell.in · accessed 20 Oct 2026
- 26bustimetables.in · bustimetables.in · accessed 20 Oct 2026
- 27cabspune.in · cabspune.in · accessed 20 Oct 2026
- 28pudhari.news · pudhari.news · accessed 20 Oct 2026
- 29team-bhp.com · team-bhp.com · accessed 20 Oct 2026
- 30nakshiq.com · nakshiq.com · accessed 20 Oct 2026
- 31ezyschooling.com · ezyschooling.com · accessed 20 Oct 2026
- 32promallu.com · promallu.com · accessed 20 Oct 2026
- 33era-india.org · era-india.org · accessed 20 Oct 2026
- 34freepressjournal.in · freepressjournal.in · accessed 20 Oct 2026
- 35bottindia.com · bottindia.com · accessed 20 Oct 2026
Air & weather: sources and methodology
Monthly averages cover 2023–2025. Each year’s monthly value is calculated first, then qualifying years receive equal weight. AQI, temperature and humidity require 90% observation coverage; rainfall requires complete daily totals. At least two years support every displayed month. Gaps show insufficient coverage.
Air quality uses mean US AQI. Temperature is air temperature at 2 metres; humidity is relative humidity at 2 metres. Rainfall is the average of each year’s monthly rainfall total. Observations use Asia/Kolkata. Collected 2026-10-20.
- Monthly mean US AQI
CAMS global archived atmospheric composition forecasts · approximately 45 km grid. Open-Meteo (CC BY 4.0); Copernicus Atmosphere Monitoring Service.
Modelled · experimental. Grid centre 17.90, 73.80.
- Air temperature
ERA5-Land historical weather · approximately 11 km grid. Open-Meteo (CC BY 4.0); Copernicus Climate Change Service / ERA5-Land.
Modelled · experimental. Grid centre 17.90, 73.80.
- Monthly rainfall
ERA5 historical rainfall · approximately 25 km grid. Open-Meteo (CC BY 4.0); Copernicus Climate Change Service / ERA5.
Modelled · experimental. Grid centre 18.00, 73.75.
- Relative humidity
ERA5-Land historical weather · approximately 11 km grid. Open-Meteo (CC BY 4.0); Copernicus Climate Change Service / ERA5-Land.
Modelled · experimental. Grid centre 17.90, 73.80.
These regional patterns provide seasonal context. Monthly means smooth out individual high-pollution days.
Local voices
What the web cannot know on its own.
Personal experience stays separate from sourced research and only becomes a public pattern after the privacy threshold.Know it firsthand?
Tell us what daily life actually feels like.
Ten structured questions create a personal portrait before community patterns enter the room.Community local read
Patterns appear after enough eligible local voices.
Your contribution can be saved now. Counts and percentages stay hidden until the privacy threshold is met.Field notes Beta
What's happening on the ground.
0 notes · 0 activeLoading field notes…
Start with your local read
Measurements work best when we know how you know the place.
Complete the neighborhood read, then take a focused four-signal mission.Satellite analysis · published
The physical story of Gowthan.
Satellite evidence showed vegetation across 78.6% of the usable area inside the analysis circle. Developed or hard-surface land was mapped across 8.4% of the usable area. Both water-detection methods agreed across 0.0% of the usable area. The wider one-method water evidence covered 0.4%.
Green cover78.6%
Built-up area8.4%
Surface temperature32.1°C
Air quality85 (India CPCB)