
Homebuyers · NRIs · Long-term buyers
Pay for location Local evidence, shown honestly
Your neighbourhood guide
Area around this place · Mumbai · IN
7/7 evidence signals establishedA field note for curious people
Kings Circle
Rail-rich, land-locked Mumbai micro-market with drainage liability and premium pricing
Kings Circle is a rail-rich, walkable South Central Mumbai pocket with strong schools, hospitals and daily convenience, but monsoon flooding at Gandhi Market and BEST outages remain unresolved. It is a premium, supply-constrained residential market: ~3% yields, tight inventory, and demand led by families and students rather than tourism.
Your neighbourhood guide is ready.
Price vs. quality of life
Is Kings Circle worth the price?
Top-tier schools, hospitals and rail justify a premium, but chronic flooding and 8-24 hour power outages undercut the price point slightly.
Buying price (per sq ft)₹31,570-58,000 / sq ft (asking, Matunga East)
Typical monthly rent₹95,000-1,40,000 / mo (2BHK)
Yearly rental return~3.0%-3.5% per year
New construction & supplyBuilt-out; redevelopment-led with scarce new towers
Find your fit
What is Kings Circle actually good for?
Get to know daily life
Everyday essentials
01
strainedCivic & utilities
Piped BMC water and waste helpline work, but flooding and outages persist
Water supplyMunicipal piped, 2-6 hrs/day city norm
Fed via BMC Kings Circle-Shiwadi tunnel; city continuity benchmarked at only 2-6 hours daily.[1][3]
Monsoon drainageChronic flood point, repeated spend
Saucer-shaped Gandhi Market junction floods; ~Rs 16 crore inlet chamber failed again in May 2025.[5][11][13]
02
strong15-minute daily life
Dense schools, hospitals, parks and food belt within a short walk
03
strongCommute & connectivity
Three suburban lines plus flyover spine, metro access only peripheral
04
mixedNew projects & what is changing
Redevelopment-only supply, with Dharavi free-sale and Sion flyover as catalysts
New supplyRedevelopment-led, ~229 units/yr
Matunga logged 1,274 redevelopment units CY21-Q1 CY26; no greenfield high-rise surge.[8]
Dharavi catalystFree-sale launch from late 2025
Adani free-sale phase near Sion and Kings Circle at ~Rs 27,000-28,000 per sq ft entry pricing.[10]
Sion flyoverReconstruction targeted 2026
Cost escalated to ~Rs 50 crore with reopening targeted between June and August 2026.[11]
05
strongBuying price & rent value
Premium asking prices with modest ~3% yields and tight inventory
Through the year
A typical year around Kings Circle
Monthly averages from 2023–2025 show how air quality and weather change with the seasons.
Monthly mean US AQI
US AQIRegional model · approximately 45 km grid
Nov: 167 US AQI3 of 3 baseline years
Air temperature
°CRegional model · approximately 11 km grid
Nov: 26.9 °C3 of 3 baseline years
Monthly rainfall
mm/monthRegional model · approximately 25 km grid
Nov: 7 mm/month3 of 3 baseline years
Relative humidity
%Regional model · approximately 11 km grid
Nov: 69 %3 of 3 baseline years
Monthly averages smooth out individual high-pollution days. Regional model data from Open-Meteo. Sources & methodology
| Month | Monthly mean US AQI | Air temperature (°C) | Monthly rainfall (mm/month) | Relative humidity (%) |
|---|---|---|---|---|
| Jan | 1623/3 years | 24.43/3 years | 03/3 years | 673/3 years |
| Feb | 1543/3 years | 25.93/3 years | 03/3 years | 623/3 years |
| Mar | 1393/3 years | 27.13/3 years | 23/3 years | 673/3 years |
| Apr | 1113/3 years | 28.83/3 years | 13/3 years | 723/3 years |
| May | 853/3 years | 29.43/3 years | 703/3 years | 773/3 years |
| Jun | 723/3 years | 28.33/3 years | 4053/3 years | 843/3 years |
| Jul | 723/3 years | 26.73/3 years | 7923/3 years | 893/3 years |
| Aug | 683/3 years | 26.73/3 years | 3693/3 years | 873/3 years |
| Sep | 693/3 years | 26.73/3 years | 4153/3 years | 863/3 years |
| Oct | 1373/3 years | 283/3 years | 763/3 years | 793/3 years |
| Nov | 1673/3 years | 26.93/3 years | 73/3 years | 693/3 years |
| Dec | 1573/3 years | 25.43/3 years | 03/3 years | 663/3 years |
Satellite X-Ray · Measured from orbit
What Kings Circle looks like from space
3.5 km radius · Jan – Mar 2025 – Jan – Mar 2026 · Deterministic physical measurements (no AI guesswork)
Heat & shade from space+8.6°C anomaly
Heat pocket (+8.6°C hotter than surroundings)
Dense rooftops and paved roads trap more solar heat here than the surrounding ring (36.5°C surface temp).
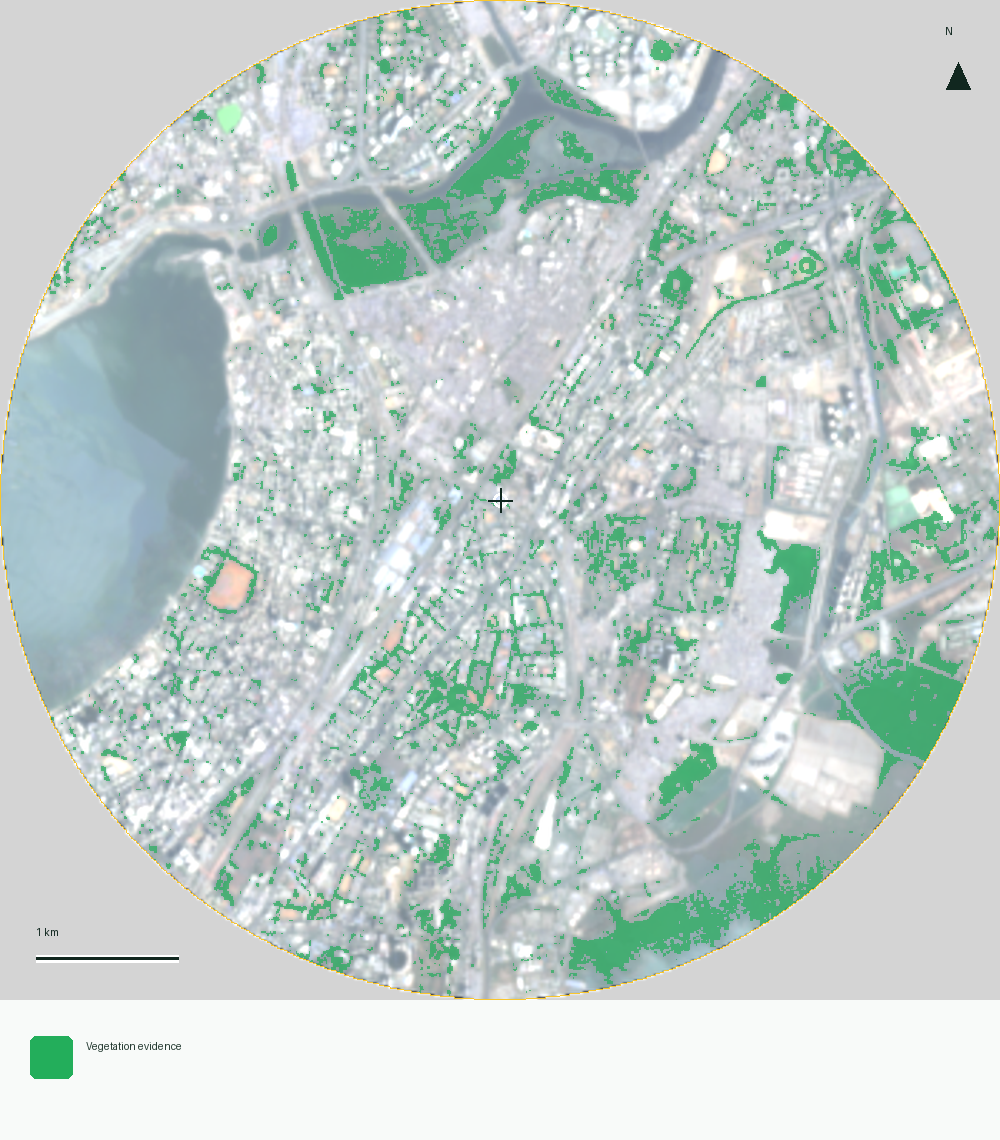
Concrete vs. tree canopy50% built · 10% green
Mixed urban density (50% built-up · 10% green cover)
Balances 50% built structures and streets with 10% visible tree and park cover.
Topography & rainwater flow8m elev · 53/100 bowl
Moderate terrain slope (53/100 runoff convergence)
Sits at ~8m elevation with typical urban slope; monsoon drainage depends on street-level storm lines.
Spatial catchment radar · 2km radius
Kings Circle on the ground
Kings Circle is located in Mumbai, IN.
Right now
Live contextUnavailable
Kings CircleArea around this place · Mumbai · INMap available when in view
Quality signals · Expected-value index
What the evidence establishes (0–100%)
7 of 7 signals have a cited estimate combining 2km map data and researched fundamentals. Blank scores need more evidence.Nearby & same-budget comparison
Compare Kings Circle with nearby & similar-price areas
Inspect the fundamental grids of neighbouring areas and similar-budget pockets side by side to compare buying prices, rental returns, and daily amenities.
Behind this guide
Sources & things to check
40 research sources · air & weather dataOpen
Behind this guide
Sources & things to check
- 01cdem.somaiya.edu · cdem.somaiya.edu · accessed 25 Oct 2026
- 02nobroker.in · nobroker.in · accessed 25 Oct 2026
- 03enews.issuelab.org · enews.issuelab.org · accessed 25 Oct 2026
- 04condivio.com · condivio.com · accessed 25 Oct 2026
- 05toivideos.timesofindia.indiatimes.com · toivideos.timesofindia.indiatimes.com · accessed 25 Oct 2026
- 06ghar.tv · ghar.tv · accessed 25 Oct 2026
- 07indianexpress.com · indianexpress.com · accessed 25 Oct 2026
- 08propertypistol.com · propertypistol.com · accessed 25 Oct 2026
- 09indianexpress.com · indianexpress.com · accessed 25 Oct 2026
- 10asraarealty.com · asraarealty.com · accessed 25 Oct 2026
- 11timesofindia.indiatimes.com · timesofindia.indiatimes.com · accessed 25 Oct 2026
- 12redesign.squareyards.com · redesign.squareyards.com · accessed 25 Oct 2026
- 13thehindu.com · thehindu.com · accessed 25 Oct 2026
- 14housing.com · housing.com · accessed 25 Oct 2026
- 15english.mathrubhumi.com · english.mathrubhumi.com · accessed 25 Oct 2026
- 16destination.com · destination.com · accessed 25 Oct 2026
- 17indianexpress.com · indianexpress.com · accessed 25 Oct 2026
- 18mumbaidreamtours.com · mumbaidreamtours.com · accessed 25 Oct 2026
- 19indianexpress.com · indianexpress.com · accessed 25 Oct 2026
- 20mumbaialertnews.com · mumbaialertnews.com · accessed 25 Oct 2026
- 21timesofindia.indiatimes.com · timesofindia.indiatimes.com · accessed 25 Oct 2026
- 22airbnb.com · airbnb.com · accessed 25 Oct 2026
- 23timesofindia.indiatimes.com · timesofindia.indiatimes.com · accessed 25 Oct 2026
- 24tripadvisor.ca · tripadvisor.ca · accessed 25 Oct 2026
- 25hindustantimes.com · hindustantimes.com · accessed 25 Oct 2026
- 26squareyards.com · squareyards.com · accessed 25 Oct 2026
- 27timesofindia.indiatimes.com · timesofindia.indiatimes.com · accessed 25 Oct 2026
- 28geoiq.io · geoiq.io · accessed 25 Oct 2026
- 29m.dailyhunt.in · m.dailyhunt.in · accessed 25 Oct 2026
- 30housing.com · housing.com · accessed 25 Oct 2026
- 31timesofindia.indiatimes.com · timesofindia.indiatimes.com · accessed 25 Oct 2026
- 32prophunt.ai · prophunt.ai · accessed 25 Oct 2026
- 33freepressjournal.in · freepressjournal.in · accessed 25 Oct 2026
- 34mid-day.com · mid-day.com · accessed 25 Oct 2026
- 35hindustantimes.com · hindustantimes.com · accessed 25 Oct 2026
- 36web.archive.org · web.archive.org · accessed 25 Oct 2026
- 37en.wikipedia.org · en.wikipedia.org · accessed 25 Oct 2026
- 38jica.go.jp · jica.go.jp · accessed 25 Oct 2026
- 39indianexpress.com · indianexpress.com · accessed 25 Oct 2026
- 40mumbaimirror.com · mumbaimirror.com · accessed 25 Oct 2026
Air & weather: sources and methodology
Monthly averages cover 2023–2025. Each year’s monthly value is calculated first, then qualifying years receive equal weight. AQI, temperature and humidity require 90% observation coverage; rainfall requires complete daily totals. At least two years support every displayed month. Gaps show insufficient coverage.
Air quality uses mean US AQI. Temperature is air temperature at 2 metres; humidity is relative humidity at 2 metres. Rainfall is the average of each year’s monthly rainfall total. Observations use Asia/Kolkata. Collected 2026-10-20.
- Monthly mean US AQI
CAMS global archived atmospheric composition forecasts · approximately 45 km grid. Open-Meteo (CC BY 4.0); Copernicus Atmosphere Monitoring Service.
Modelled · experimental. Grid centre 19.00, 72.90.
- Air temperature
ERA5-Land historical weather · approximately 11 km grid. Open-Meteo (CC BY 4.0); Copernicus Climate Change Service / ERA5-Land.
Modelled · experimental. Grid centre 19.00, 72.90.
- Monthly rainfall
ERA5 historical rainfall · approximately 25 km grid. Open-Meteo (CC BY 4.0); Copernicus Climate Change Service / ERA5.
Modelled · experimental. Grid centre 19.00, 73.00.
- Relative humidity
ERA5-Land historical weather · approximately 11 km grid. Open-Meteo (CC BY 4.0); Copernicus Climate Change Service / ERA5-Land.
Modelled · experimental. Grid centre 19.00, 72.90.
These regional patterns provide seasonal context. Monthly means smooth out individual high-pollution days.
Local voices
What the web cannot know on its own.
Personal experience stays separate from sourced research and only becomes a public pattern after the privacy threshold.Know it firsthand?
Tell us what daily life actually feels like.
Ten structured questions create a personal portrait before community patterns enter the room.Community local read
Patterns appear after enough eligible local voices.
Your contribution can be saved now. Counts and percentages stay hidden until the privacy threshold is met.Field notes Beta
What's happening on the ground.
0 notes · 0 activeLoading field notes…
Start with your local read
Measurements work best when we know how you know the place.
Complete the neighborhood read, then take a focused four-signal mission.Satellite analysis · published
The physical story of Kings Circle.
Satellite evidence showed vegetation across 19.1% of the usable area inside the analysis circle. Developed or hard-surface land was mapped across 33.8% of the usable area. Both water-detection methods agreed across 10.7% of the usable area. The wider one-method water evidence covered 17.8%.
Green cover10.0%
Built-up area50.0%
Surface temperature36.5°C
Air quality56 (India CPCB)