indus city
Local evidence, shown honestly
Your neighbourhood guide

Area around this place · Hyderabad · Telangana · India

7/7 evidence signals established
A field note for curious people

HITEC City

A partial, cited view of HITEC City

5/7 chapters available16 source links

Your neighbourhood guide is ready.

Price vs. quality of life

Is HITEC City worth the price?

Established & expensive

HITEC City is Hyderabad's premier information technology township, spread across 151 acres in Madhapur and surrounding suburbs.

Buying price (per sq ft)₹5,800 to ₹9,200 per sq ft
Typical monthly rentrent rising from ₹23,000
Yearly rental returnNot established yet
New construction & supplyMany new towers coming up

Find your fit

What is HITEC City actually good for?

Choose what brings you here to explore the details, trade-offs, and things to check in person.
Homebuyers · NRIs · Long-term buyers

Buying a home: Established address with scarce land supply; works for long-term wealth preservation, though entry prices are steep.

Established & expensive

Why it works here

  • HITEC City residential costs rose sharply between end-2021 and H1 2024, with Anarock Research data reported by Telangana Today showing average monthly rent for a typical…[11]

What could hurt returns or daily life

  • GHMC teams with traffic police removed roadside sheds and kiosks around the Mindspace building in Hitec City (as of 30 Nov 2025) to ease congestion in the IT corridor,…[8]
  • An Anarock update reported by RegNews indicates HITEC City rents continued climbing into 2025, with a 1,000 sq ft apartment rent rising from ₹23,000 at end-2021 to ₹36,350…[6]
Verify before committing: Compare recent registered sale prices against listing asking rates and verify piped water pressure, drainage, and utility backup.

Get to know daily life

Everyday essentials

Water, walkability, commutes, construction, and prices, informed by nearby places and resident voices.
01

Civic & utilities

strong

Street layout, drainage, and civic infrastructure reliability

Built form & street upkeepEstablished

GHMC teams with traffic police removed roadside sheds and kiosks around the Mindspace building in Hitec City (as of 30 Nov 2025) to ease congestion in the IT corridor, prompting protests from…[8]

Does this ring true?
02

15-minute daily life

strong

Parks, avenue greening, and cultural open space in the HITEC City corridor

Healthcare20 within 2km · nearest 174m

Includes Dr. Venkatesh, Treated 2K+ Patients | Best General Physician in Hyderabad | Fever & Diabetes Doctor, Dr Pratapa Varma Penmetsa within a 2km catchment.

Education & learning12 within 2km · nearest 102m

Includes Sarxdd, Pathrica nagar within a 2km catchment.

Parks & recreation19 within 2km · nearest 180m

Includes Demo Area, Phoenix Foundation within a 2km catchment.

Local markets & shopping17 within 2km · nearest 102m

Includes icon show room, Phoenix Tower A within a 2km catchment.

Does this ring true?
03

Commute & connectivity

mixed

Mobility and Daily Life in HITEC City

Mapped transit stops1 within 2km · nearest 298m

Nearest transit or station stop is 298m away.

Commute & road frictionPeak-hour bottleneck

Cyberabad Traffic Police reported that over 2.[16]

Transit & accessConnected corridor

A follow-up meeting between HYSEA and the Cyberabad Police Commissioner on 18 Dec 2024 listed medium-term priorities for HITEC City including development of parking and bus bays, construction of…[4]

Transit & accessConnected corridor

The Telangana government, via HMRL, was moving ahead in January 2025 with a Personal Rapid Transit system whose Corridor-II links Raidurg, Tech Mahindra, Hitech City and Kondapur, a 6 km route with…[5]

Does this ring true?
04

New projects & what is changing

mixed

HITEC City in Transition: Office Expansion, Station Rebuild, Enforcement and Congestion

Active headwind / riskExecution friction

GHMC teams with traffic police removed roadside sheds and kiosks around the Mindspace building in Hitec City (as of 30 Nov 2025) to ease congestion in the IT corridor, prompting protests from…[8]

Development & changeActive transformation

The Cyberabad/Hitec City corridor is under mounting gridlock pressure (as of 7 Oct 2025), with a 30-45 minute commute often stretching beyond an hour at peak times, tied to nearly 80-90 lakh…[13]

Does this ring true?
05

Buying price & rent value

mixed

Affordability and Cost in HITEC City

Typical buying price₹5,800 to ₹9,200 per sq ft

HITEC City residential costs rose sharply between end-2021 and H1 2024, with Anarock Research data reported by Telangana Today showing average monthly rent for a typical apartment increasing from…[11]

Monthly rent & yearly returnrent rising from ₹23,000 · Not established yet

An Anarock update reported by RegNews indicates HITEC City rents continued climbing into 2025, with a 1,000 sq ft apartment rent rising from ₹23,000 at end-2021 to ₹36,350 by Q2 2025 (58% increase),…[6]

Market pressureReported trend

The Flex Insights, citing Anarock's CY 2024 India Office Market Update, reports Hyderabad's average office rent rose to ₹67 per sq ft per month, up 20% since 2019, with HITEC City and Banjara Hills…[14]

Does this ring true?

Through the year

A typical year around HITEC City

Monthly averages from 2023–2025 show how air quality and weather change with the seasons.

Monthly mean US AQI

US AQI

Regional model · approximately 45 km grid

063125JanJan: 120 US AQI · 3 yearsFebFeb: 103 US AQI · 3 yearsMarMar: 104 US AQI · 3 yearsAprApr: 106 US AQI · 3 yearsMayMay: 93 US AQI · 3 yearsJunJun: 67 US AQI · 3 yearsJulJul: 43 US AQI · 3 yearsAugAug: 59 US AQI · 3 yearsSepSep: 66 US AQI · 3 yearsOctOct: 93 US AQI · 3 yearsNovNov: 120 US AQI · 3 yearsDecDec: 116 US AQI · 3 years

Nov: 120 US AQI3 of 3 baseline years

Air temperature

°C

Regional model · approximately 11 km grid

152535JanJan: 21.9 °C · 3 yearsFebFeb: 24.7 °C · 3 yearsMarMar: 27.1 °C · 3 yearsAprApr: 29.8 °C · 3 yearsMayMay: 29.3 °C · 3 yearsJunJun: 27.4 °C · 3 yearsJulJul: 24.3 °C · 3 yearsAugAug: 24.6 °C · 3 yearsSepSep: 24.1 °C · 3 yearsOctOct: 24.2 °C · 3 yearsNovNov: 22.1 °C · 3 yearsDecDec: 20.8 °C · 3 years

Nov: 22.1 °C3 of 3 baseline years

Monthly rainfall

mm/month

Regional model · approximately 25 km grid

0165330JanJan: 0 mm/month · 3 yearsFebFeb: 0 mm/month · 3 yearsMarMar: 20 mm/month · 3 yearsAprApr: 18 mm/month · 3 yearsMayMay: 65 mm/month · 3 yearsJunJun: 117 mm/month · 3 yearsJulJul: 327 mm/month · 3 yearsAugAug: 194 mm/month · 3 yearsSepSep: 308 mm/month · 3 yearsOctOct: 64 mm/month · 3 yearsNovNov: 16 mm/month · 3 yearsDecDec: 8 mm/month · 3 years

Nov: 16 mm/month3 of 3 baseline years

Relative humidity

%

Regional model · approximately 11 km grid

050100JanJan: 58 % · 3 yearsFebFeb: 45 % · 3 yearsMarMar: 44 % · 3 yearsAprApr: 44 % · 3 yearsMayMay: 56 % · 3 yearsJunJun: 67 % · 3 yearsJulJul: 82 % · 3 yearsAugAug: 81 % · 3 yearsSepSep: 83 % · 3 yearsOctOct: 75 % · 3 yearsNovNov: 70 % · 3 yearsDecDec: 64 % · 3 years

Nov: 70 %3 of 3 baseline years

Monthly averages smooth out individual high-pollution days. Regional model data from Open-Meteo. Sources & methodology

Monthly averages and contributing years, 2023–2025
MonthMonthly mean US AQIAir temperature (°C)Monthly rainfall (mm/month)Relative humidity (%)
Jan1203/3 years21.93/3 years03/3 years583/3 years
Feb1033/3 years24.73/3 years03/3 years453/3 years
Mar1043/3 years27.13/3 years203/3 years443/3 years
Apr1063/3 years29.83/3 years183/3 years443/3 years
May933/3 years29.33/3 years653/3 years563/3 years
Jun673/3 years27.43/3 years1173/3 years673/3 years
Jul433/3 years24.33/3 years3273/3 years823/3 years
Aug593/3 years24.63/3 years1943/3 years813/3 years
Sep663/3 years24.13/3 years3083/3 years833/3 years
Oct933/3 years24.23/3 years643/3 years753/3 years
Nov1203/3 years22.13/3 years163/3 years703/3 years
Dec1163/3 years20.83/3 years83/3 years643/3 years

Satellite X-Ray · Measured from orbit

What HITEC City looks like from space

3.5 km radius · Jan – Mar 2023 – Apr – Jun 2026 · Deterministic physical measurements (no AI guesswork)

Full satellite report

Measurements cover an approximate area around this place, not its exact administrative or property boundary.

Weather and Climate history: unavailable in this report. Available satellite layers remain usable. The guide’s seasonal weather charts use a separate data source.

60.1% Roofs, roads & concrete 13.5% Vegetation & greenery 26.4% Open ground / water
Heat & shade from space-0.7°C anomaly

Average neighbourhood heat (-0.7°C vs. surroundings)

Surface heat tracks closely with the surrounding city ring (42.1°C roof/road surface temp).

Concrete vs. tree canopy60.1% built · 13.5% green

4.5× more concrete than greenery (60.1% built-up · 13.5% green)

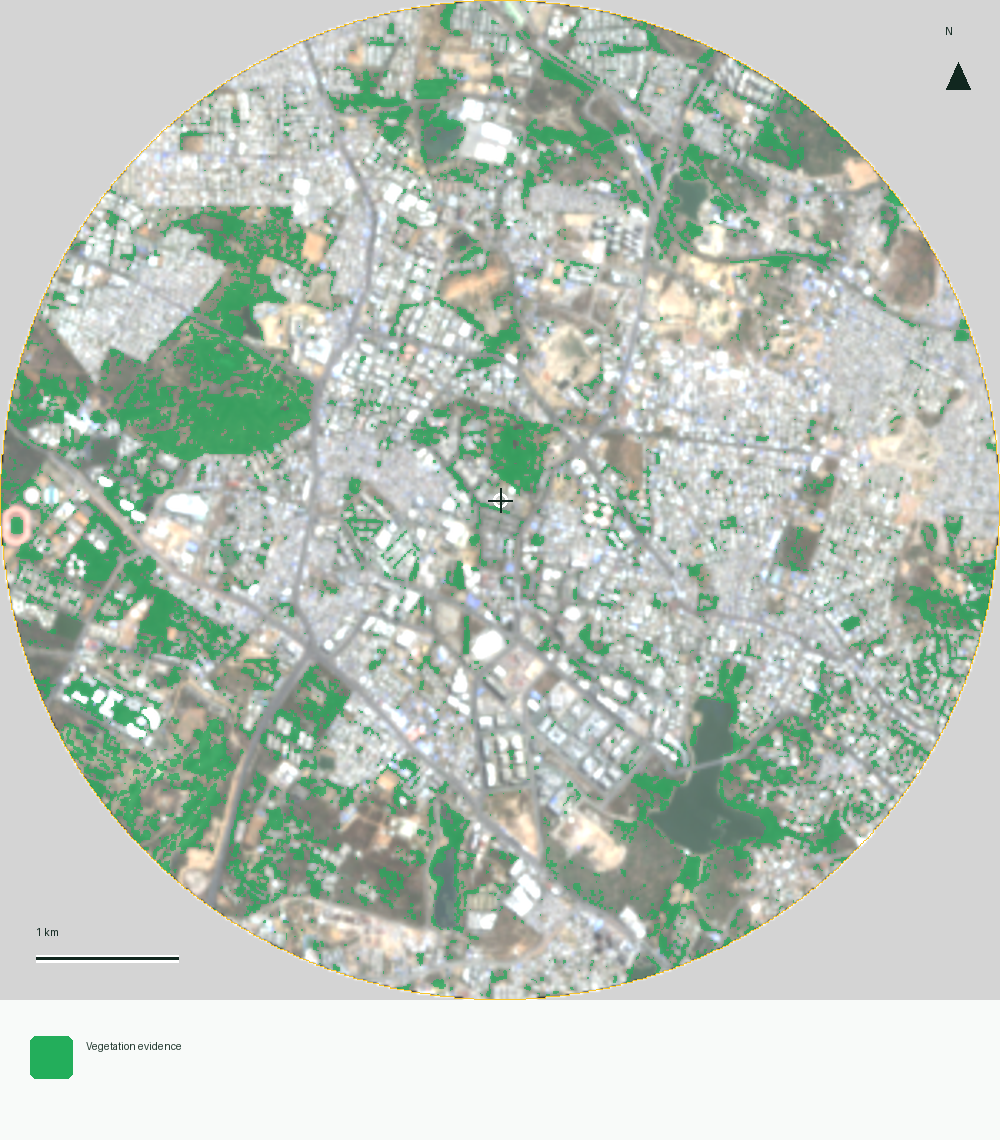
Roofs, roads, and hard surfaces cover 60.1% of the ground while tree and garden canopy covers 13.5%.

Topography & rainwater flow584m elev · 33/100 bowl

Higher / sloped ground (33/100 runoff convergence)

Sits on shedding terrain (~584m elevation) where rainwater naturally flows outward.

Vegetation satellite scan for HITEC City
Vegetation coverMicrosoft Planetary Computer · Sentinel-2

Spatial catchment radar · 2km radius

HITEC City on the ground

HITEC City is located within Hyderabad, Telangana, India.

Right now
Live contextUnavailable
HITEC CityArea around this place · Hyderabad · Telangana · IndiaMap available when in view

Quality signals · Expected-value index

What the evidence establishes (0–100%)

7 of 7 signals have a cited estimate combining 2km map data and researched fundamentals. Blank scores need more evidence.

Nearby & same-budget comparison

Compare HITEC City with nearby & similar-price areas

Inspect the fundamental grids of neighbouring areas and similar-budget pockets side by side to compare buying prices, rental returns, and daily amenities.

Behind this guide

Sources & things to check

16 research sources · air & weather dataOpen
  1. 01en.wikipedia.org · en.wikipedia.org · accessed 14 Sept 2026
  2. 02fragments.dbpedia.org · fragments.dbpedia.org · accessed 14 Sept 2026
  3. 03hydlitfest.org · hydlitfest.org · accessed 14 Sept 2026
  4. 04hysea.in · hysea.in · accessed 14 Sept 2026
  5. 05metrorailtoday.com · metrorailtoday.com · accessed 14 Sept 2026
  6. 06regnews.in · regnews.in · accessed 14 Sept 2026
  7. 07shilparamam.in · shilparamam.in · accessed 14 Sept 2026
  8. 08telanganatoday.com · telanganatoday.com · accessed 14 Sept 2026
  9. 09telanganatoday.com · telanganatoday.com · accessed 14 Sept 2026
  10. 10telanganatoday.com · telanganatoday.com · accessed 14 Sept 2026
  11. 11telanganatoday.com · telanganatoday.com · accessed 14 Sept 2026
  12. 12telanganatoday.com · telanganatoday.com · accessed 14 Sept 2026
  13. 13telanganatoday.com · telanganatoday.com · accessed 14 Sept 2026
  14. 14theflexinsights.com · theflexinsights.com · accessed 14 Sept 2026
  15. 15metroindia.net · metroindia.net · accessed 14 Sept 2026
  16. 16telanganatribune.com · telanganatribune.com · accessed 14 Sept 2026

Air & weather: sources and methodology

Monthly averages cover 2023–2025. Each year’s monthly value is calculated first, then qualifying years receive equal weight. AQI, temperature and humidity require 90% observation coverage; rainfall requires complete daily totals. At least two years support every displayed month. Gaps show insufficient coverage.

Air quality uses mean US AQI. Temperature is air temperature at 2 metres; humidity is relative humidity at 2 metres. Rainfall is the average of each year’s monthly rainfall total. Observations use Asia/Kolkata. Collected 2026-10-20.

  • Monthly mean US AQI

    CAMS global archived atmospheric composition forecasts · approximately 45 km grid. Open-Meteo (CC BY 4.0); Copernicus Atmosphere Monitoring Service.

    Modelled · experimental. Grid centre 17.40, 78.40.

  • Air temperature

    ERA5-Land historical weather · approximately 11 km grid. Open-Meteo (CC BY 4.0); Copernicus Climate Change Service / ERA5-Land.

    Modelled · experimental. Grid centre 17.40, 78.40.

  • Monthly rainfall

    ERA5 historical rainfall · approximately 25 km grid. Open-Meteo (CC BY 4.0); Copernicus Climate Change Service / ERA5.

    Modelled · experimental. Grid centre 17.50, 78.50.

  • Relative humidity

    ERA5-Land historical weather · approximately 11 km grid. Open-Meteo (CC BY 4.0); Copernicus Climate Change Service / ERA5-Land.

    Modelled · experimental. Grid centre 17.40, 78.40.

These regional patterns provide seasonal context. Monthly means smooth out individual high-pollution days.