Area around this place · Bengaluru · Karnataka · India
7/7 evidence signals established
A field note for curious people
Bellandur
Bellandur: IT hub with ancient roots and a lake in recovery
Bellandur is an eastern Bengaluru locality defined by the tension between its IT-driven present and its deep past. Once a small farming village of about fifteen families, it became self-governing in 1962 and saw its land records digitised in 1998 before the tech boom transformed it. Today it hosts major technology campuses like Brookfield Ecoworld and upscale gated communities such as Adarsh Palm Retreat. The area's rental market is among India's most expensive, with average monthly rents of ₹86,000 to ₹3,10,000 in Q3 2025. Bellandur Lake, an ancient tank dating back over a millennium, remains a focal point of environmental concern and ongoing rejuvenation efforts.
7/7 chapters available22 source links
Your neighbourhood guide is ready.
Price vs. quality of life
Is Bellandur worth the price?
Established & expensive
Bellandur is an eastern Bengaluru locality defined by the tension between its IT-driven present and its deep past.
Buying price (per sq ft)Not established in sources
Typical monthly rentrents of ₹86,000 to ₹3,10,000
Yearly rental returnNot established yet
New construction & supplyMix of older & new buildings
Find your fit
What is Bellandur actually good for?
Choose what brings you here to explore the details, trade-offs, and things to check in person.
Homebuyers · NRIs · Long-term buyers
Buying a home: Established address with scarce land supply; works for long-term wealth preservation, though entry prices are steep.
Established & expensive
Why it works here
Bellandur recorded average monthly rental values of roughly ₹86,000 to ₹3,10,000 in Q3 2025, a 6% year-over-year increase.[18]
Bellandur lies within an area recorded in ancient inscriptions as "Veppur Nadu" or "Bempuru Nadu," a locality that also included Begur, Ibbalur and Jakkasandra; a British…[19]
What could hurt returns or daily life
Bellandur Lake's buffer zone is the focus of a planned ~1 km long, 24-metre-wide road meant to ease congestion on the Bellandur bund road, with the Chief Commissioner of the…[22][16]
Bellandur is identified, alongside Whitefield and Sarjapur Road, as one of India's most rapidly appreciating rental zones in East Bengaluru, with demand attributed to an…[13]
Get to know daily life
Everyday essentials
Water, walkability, commutes, construction, and prices, informed by nearby places and resident voices.
01
Civic & utilities
strong
Bellandur's built form: IT campuses, gated enclaves and a divided street fabric
Built form & street upkeepEstablished
Bellandur's built form centres on large technology campuses, including Brookfield Ecoworld, paired with upscale gated housing such as Adarsh Palm Retreat.[3]
Built form & street upkeepEstablished
Bellandur's street fabric is sharply uneven: aerial imagery shared in March 2025 shows one part laid out in an orderly grid while an adjacent part is congested and densely packed with irregular…[21]
Built form & street upkeepEstablished
A roughly 1 km, 24-metre-wide buffer-zone road corridor near Bellandur Lake was ordered for survey by the Greater Bengaluru Authority in December 2025, with the aim of relieving the bund road and…[14]
02
15-minute daily life
strong
Parks, playgrounds and reclaimed public space in Bellandur
Healthcare15 within 2km · nearest 41m
Includes Dr. JAYADATTA G PAWAR|Best General Surgeon near me|11 yrs Exp| Bengaluru, Dr.Mithun N Oswal - ORTHOPEDIC SURGEON/ Best Knee Replacement Surgeon/ ACL Surgery/ 12+ YRS Exp within a 2km catchment.
Education & learning14 within 2km · nearest 143m
Includes Ammu Missile, స్వర్ణాంధ్ర ప్రదేశ్ పార్టీ within a 2km catchment.
Parks & recreation19 within 2km · nearest 485m
Includes Children's Park, Jogger's Park within a 2km catchment.
Local markets & shopping15 within 2km · nearest 6m
Includes Grant Supermarket, KARMEGAM STORE within a 2km catchment.
03
Commute & connectivity
mixed
Commuting in Bellandur: ORR congestion and a diversion trial
Mapped transit stops2 within 2km · nearest 418m
Nearest transit or station stop is 418m away.
Commute & road frictionPeak-hour bottleneck
Bellandur residents report severe daily commute friction along the Outer Ring Road corridor, citing pothole-ridden roads, broken footpaths, poorly maintained bus shelters, illegal pavement…[20]
Commute & road frictionPeak-hour bottleneck
Bellandur-bound commuters are affected by congestion at Devarabeesanahalli Junction, described as a bottleneck for people navigating Bellandur, HSR Layout and Eco World; Bengaluru traffic police…[12]
04
New projects & what is changing
mixed
Bellandur's Current Change: Road Surveys, Lake Funding and Metro Investment
Development & changeActive transformation
Bellandur Lake's buffer zone is the focus of a planned ~1 km long, 24-metre-wide road meant to ease congestion on the Bellandur bund road, with the Chief Commissioner of the Greater Bengaluru…[22][16]
Active headwind / riskExecution friction
Bellandur Lake restoration and desilting remained stalled with officials targeting completion by end of March 2026, and a lack of funds meant no on-ground progress between November 2024 and April…[15][1]
Development & changeActive transformation
Bellandur Metro station on the upcoming Blue Line along the Outer Ring Road corridor is set to receive a Rs 120 crore upgrade under an agreement between the Prestige Group and BMRCL, which targets a…[11]
Development & changeActive transformation
Bellandur was a small farming village of roughly fifteen families when three Reddy families arrived around 1914; it became self-governing through a village Panchayat in 1962, gained a bus link to…[2]
05
Buying price & rent value
mixed
Bellandur Rents and Cost Pressure
Typical buying priceNot established in sources
Bellandur recorded average monthly rental values of roughly ₹86,000 to ₹3,10,000 in Q3 2025, a 6% year-over-year increase.[18]
Monthly rent & yearly returnrents of ₹86,000 to ₹3,10,000 · Not established yet
Bellandur is identified, alongside Whitefield and Sarjapur Road, as one of India's most rapidly appreciating rental zones in East Bengaluru, with demand attributed to an influx of technology-sector…[13]
Market pressureReported trend
Rent in high-demand areas including Bellandur surged by as much as 35% over the prior year, with landlords recovering pandemic losses and capturing demand from employees returning to offices.[6]
Through the year
A typical year around Bellandur
Monthly averages from 2023–2025 show how air quality and weather change with the seasons.
Monthly mean US AQI
US AQI
Regional model · approximately 45 km grid
Nov: 81 US AQI3 of 3 baseline years
Air temperature
°C
Regional model · approximately 11 km grid
Nov: 21.4 °C3 of 3 baseline years
Monthly rainfall
mm/month
Regional model · approximately 25 km grid
Nov: 73 mm/month3 of 3 baseline years
Relative humidity
%
Regional model · approximately 11 km grid
Nov: 79 %3 of 3 baseline years
Monthly averages smooth out individual high-pollution days. Regional model data from Open-Meteo. Sources & methodology
Monthly averages and contributing years, 2023–2025
Month
Monthly mean US AQI
Air temperature (°C)
Monthly rainfall (mm/month)
Relative humidity (%)
Jan
923/3 years
20.33/3 years
103/3 years
693/3 years
Feb
873/3 years
233/3 years
03/3 years
513/3 years
Mar
903/3 years
25.33/3 years
133/3 years
513/3 years
Apr
933/3 years
273/3 years
323/3 years
533/3 years
May
833/3 years
25.43/3 years
1723/3 years
733/3 years
Jun
483/3 years
23.83/3 years
1073/3 years
783/3 years
Jul
303/3 years
22.63/3 years
1653/3 years
813/3 years
Aug
493/3 years
233/3 years
1373/3 years
793/3 years
Sep
453/3 years
233/3 years
583/3 years
783/3 years
Oct
793/3 years
22.83/3 years
1403/3 years
783/3 years
Nov
813/3 years
21.43/3 years
733/3 years
793/3 years
Dec
863/3 years
20.43/3 years
393/3 years
773/3 years
Satellite X-Ray · Measured from orbit
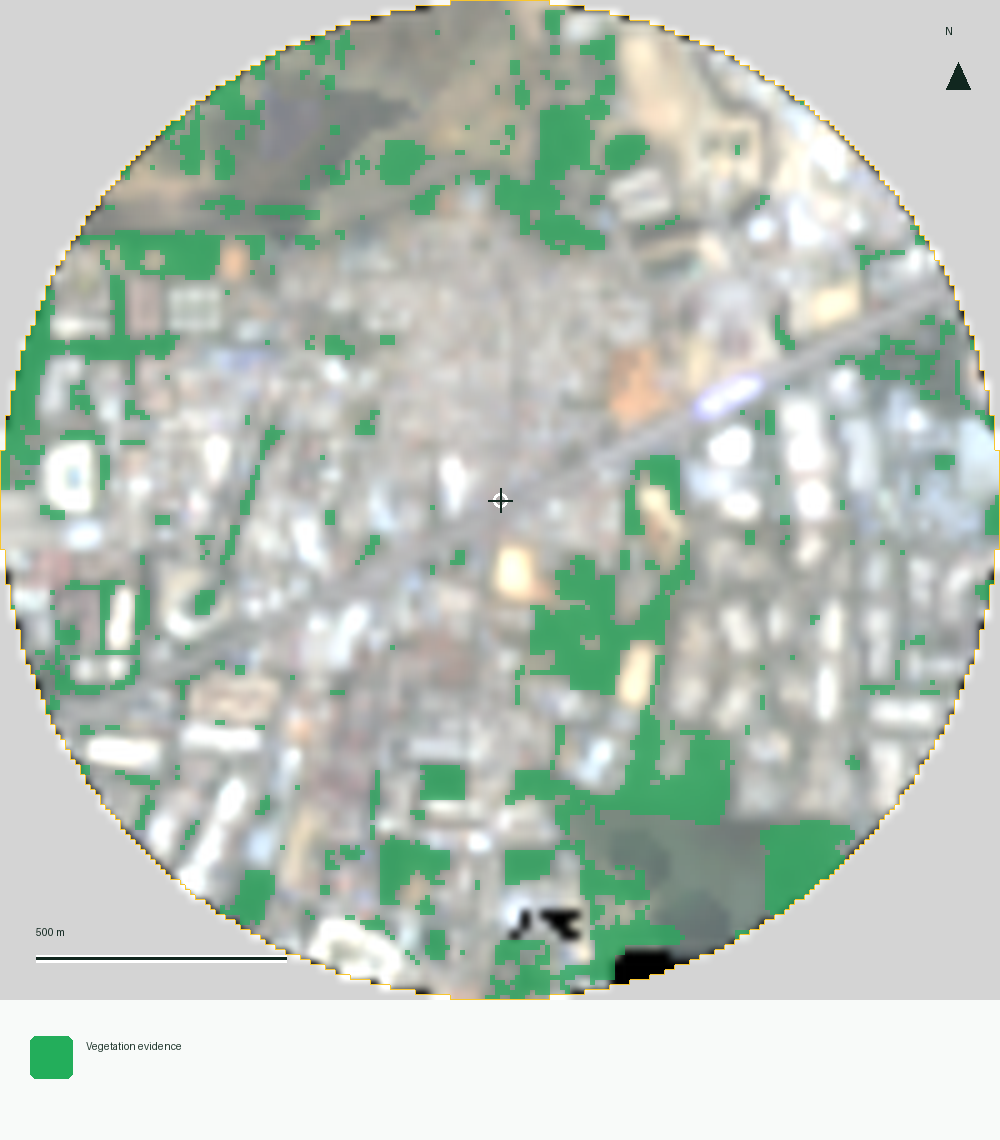
What Bellandur looks like from space
1 km radius · Jan – Mar 2025 – Apr – Jun 2026 · Deterministic physical measurements (no AI guesswork)
Monthly averages cover 2023–2025. Each year’s monthly value is calculated first, then qualifying years receive equal weight. AQI, temperature and humidity require 90% observation coverage; rainfall requires complete daily totals. At least two years support every displayed month. Gaps show insufficient coverage.
Air quality uses mean US AQI. Temperature is air temperature at 2 metres; humidity is relative humidity at 2 metres. Rainfall is the average of each year’s monthly rainfall total. Observations use Asia/Kolkata. Collected 2026-10-20.
Modelled · experimental. Grid centre 12.90, 77.70.
Air temperature
ERA5-Land historical weather · approximately 11 km grid. Open-Meteo (CC BY 4.0); Copernicus Climate Change Service / ERA5-Land.
Modelled · experimental. Grid centre 12.90, 77.70.
Monthly rainfall
ERA5 historical rainfall · approximately 25 km grid. Open-Meteo (CC BY 4.0); Copernicus Climate Change Service / ERA5.
Modelled · experimental. Grid centre 13.00, 77.75.
Relative humidity
ERA5-Land historical weather · approximately 11 km grid. Open-Meteo (CC BY 4.0); Copernicus Climate Change Service / ERA5-Land.
Modelled · experimental. Grid centre 12.90, 77.70.
These regional patterns provide seasonal context. Monthly means smooth out individual high-pollution days.
Local voices
What the web cannot know on its own.
Personal experience stays separate from sourced research and only becomes a public pattern after the privacy threshold.
Know it firsthand?
Tell us what daily life actually feels like.
Ten structured questions create a personal portrait before community patterns enter the room.
Community local read
Patterns appear after enough eligible local voices.
Your contribution can be saved now. Counts and percentages stay hidden until the privacy threshold is met.
Field notes Beta
What's happening on the ground.
0 notes · 0 active
Loading field notes…
Start with your local read
Measurements work best when we know how you know the place.
Complete the neighborhood read, then take a focused four-signal mission.
Satellite analysis · published
The physical story of Bellandur.
Satellite evidence showed vegetation across 13.0% of the usable area inside the analysis circle. Developed or hard-surface land was mapped across 30.3% of the usable area. Both water-detection methods agreed across 0.7% of the usable area. The wider one-method water evidence covered 9.7%.
Measurements cover an approximate area around this place, not its exact administrative or property boundary.